
Streamlit,
360° Artist Performance Analytics & Streaming Intelligence Platform
Streamlit — Automation Case Study
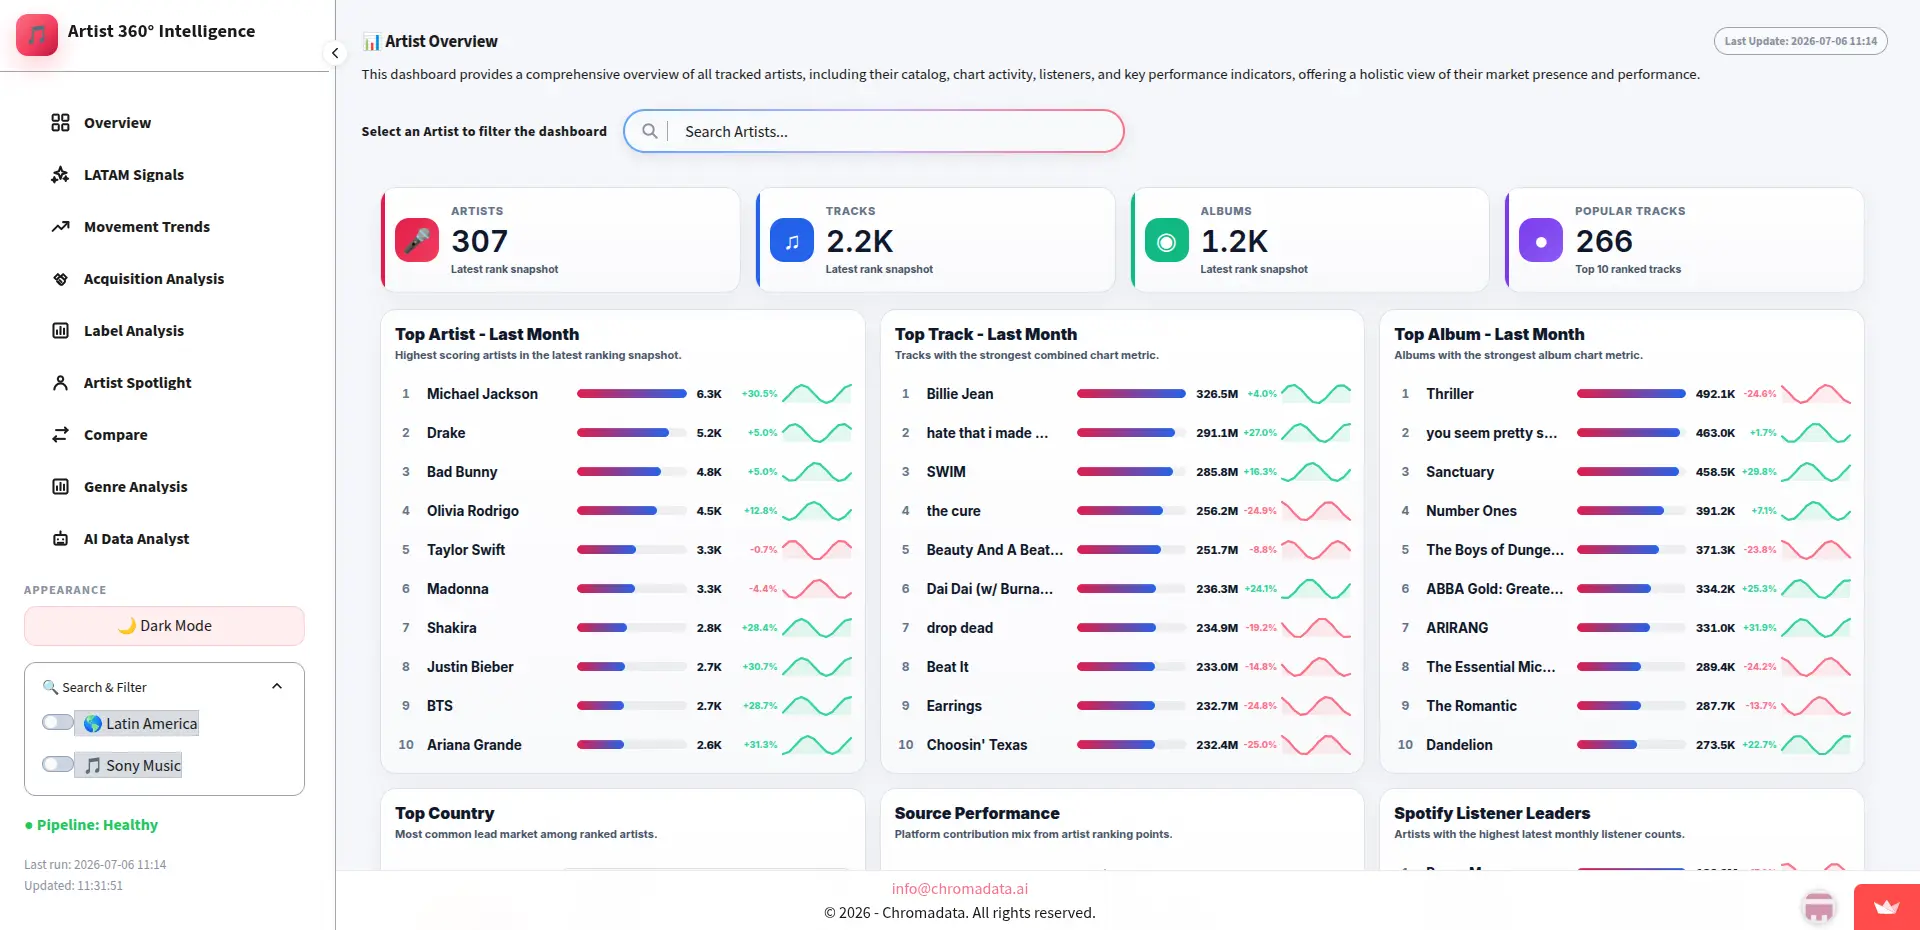
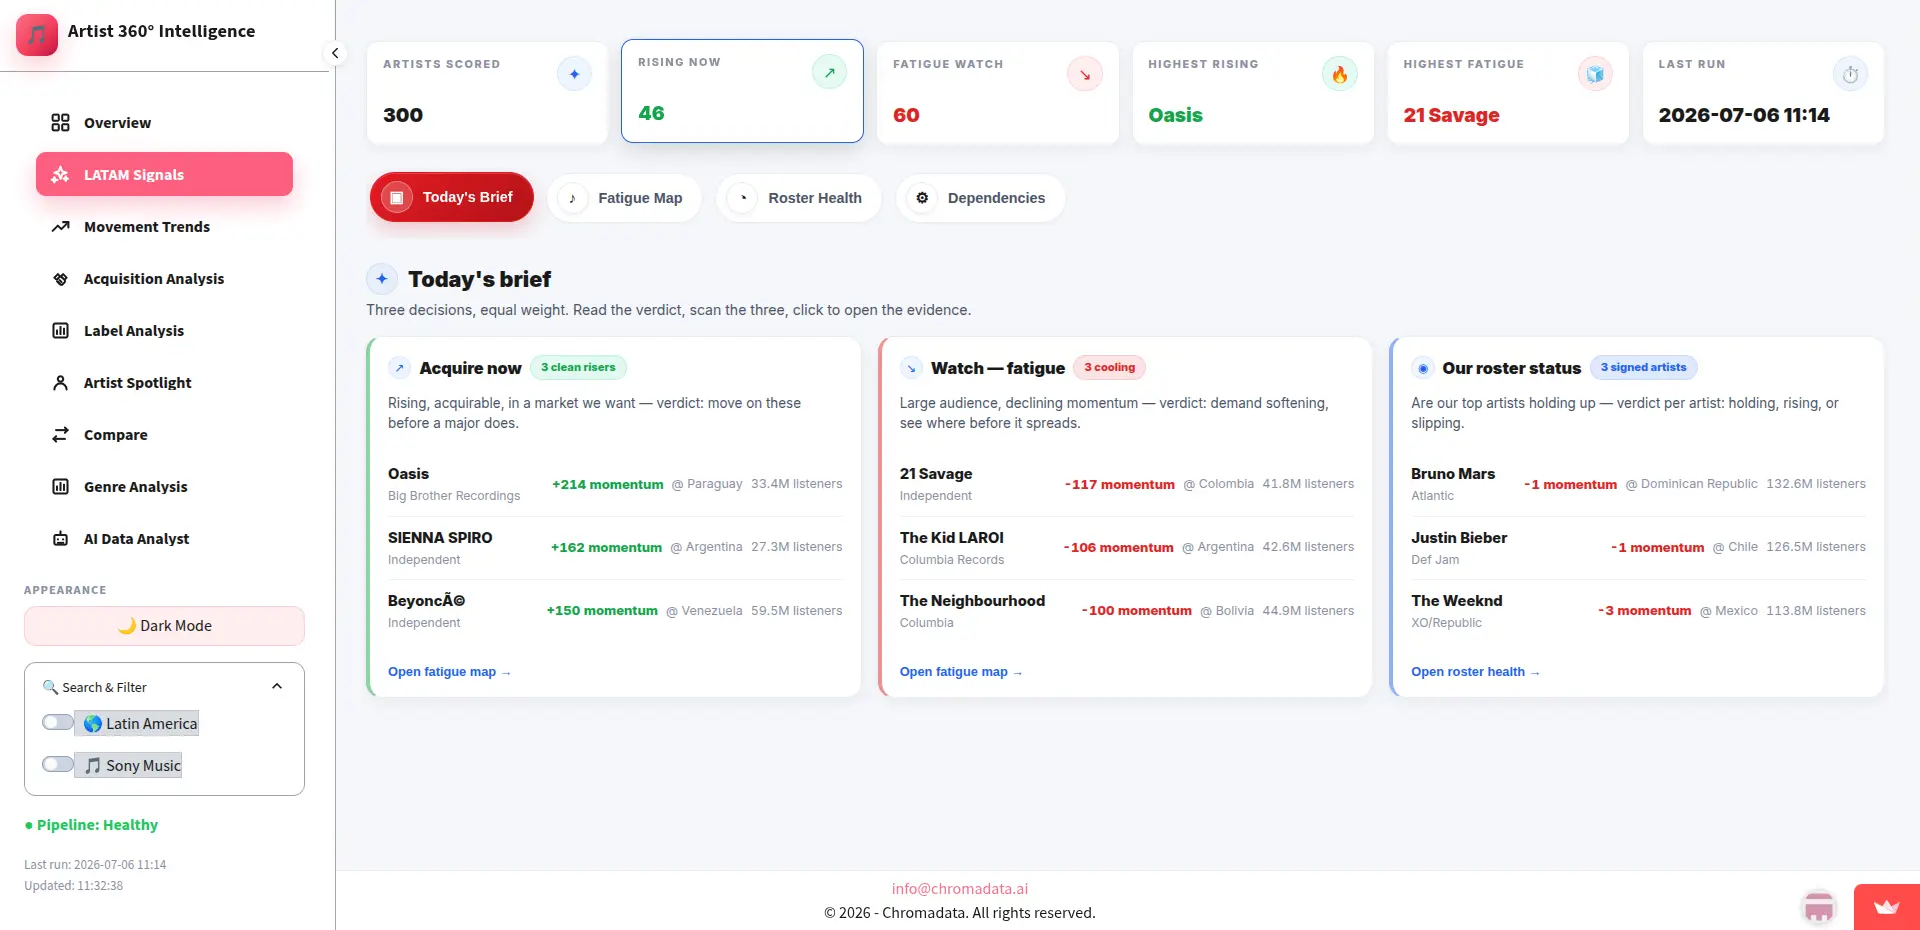
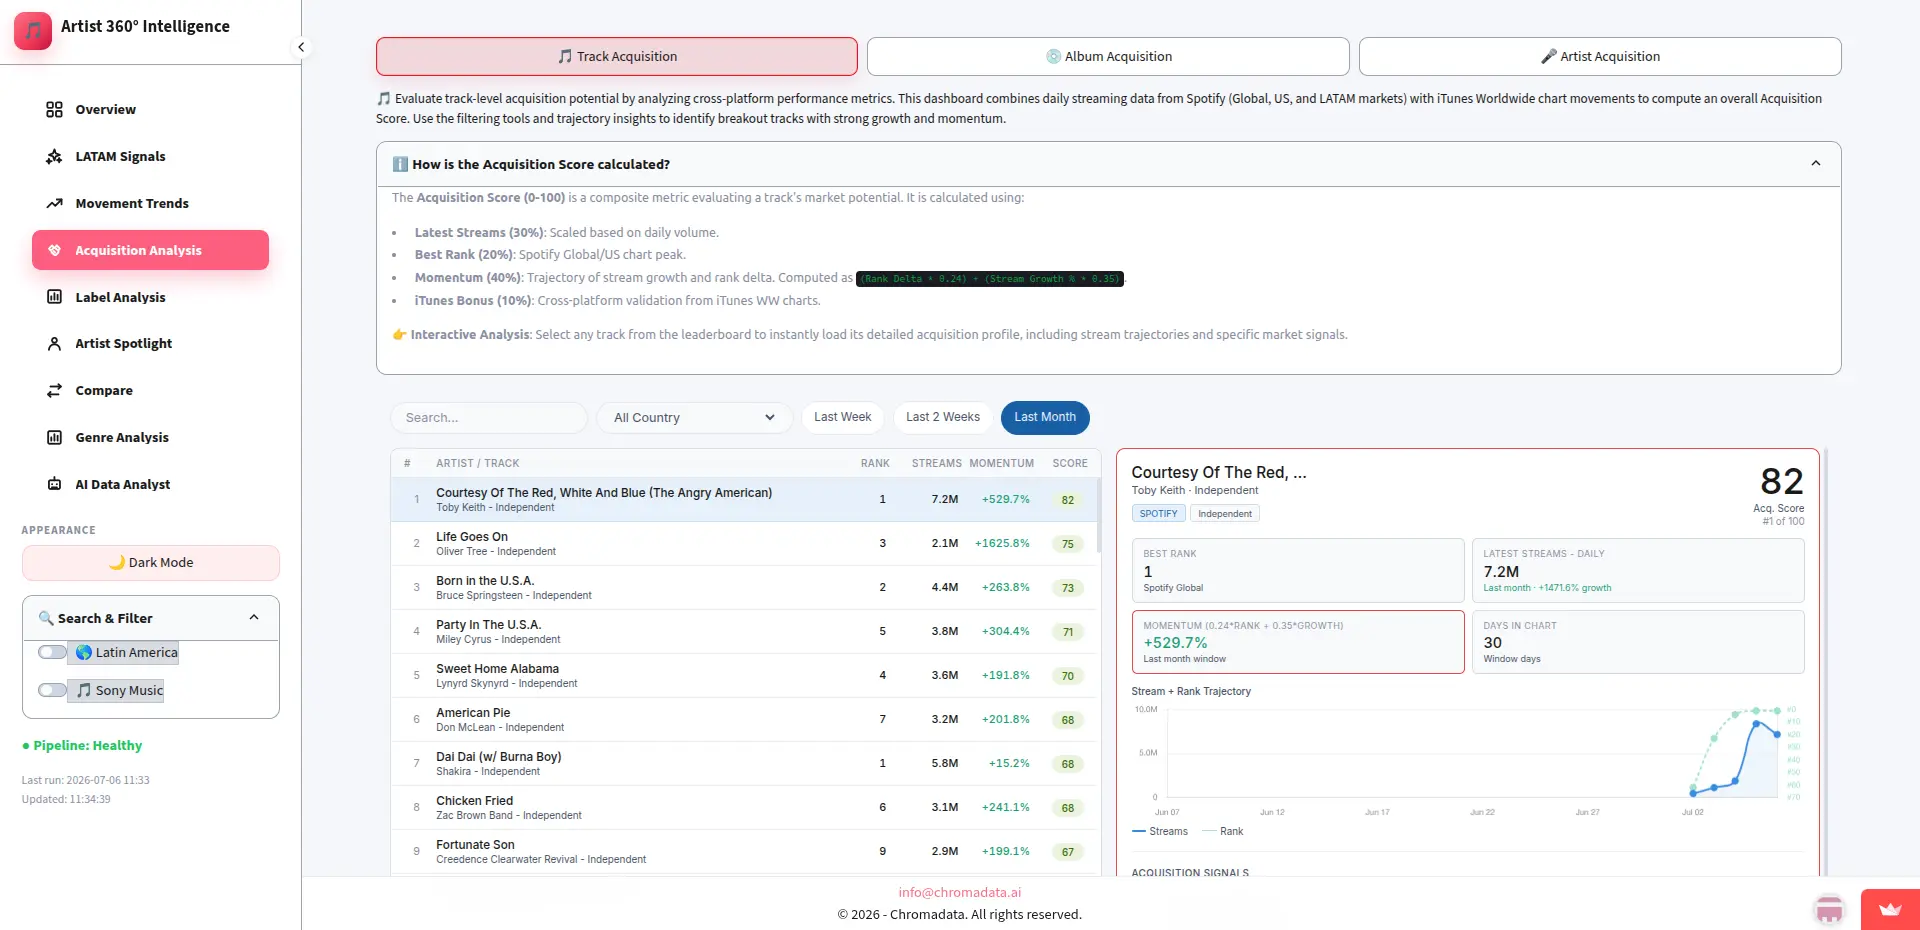
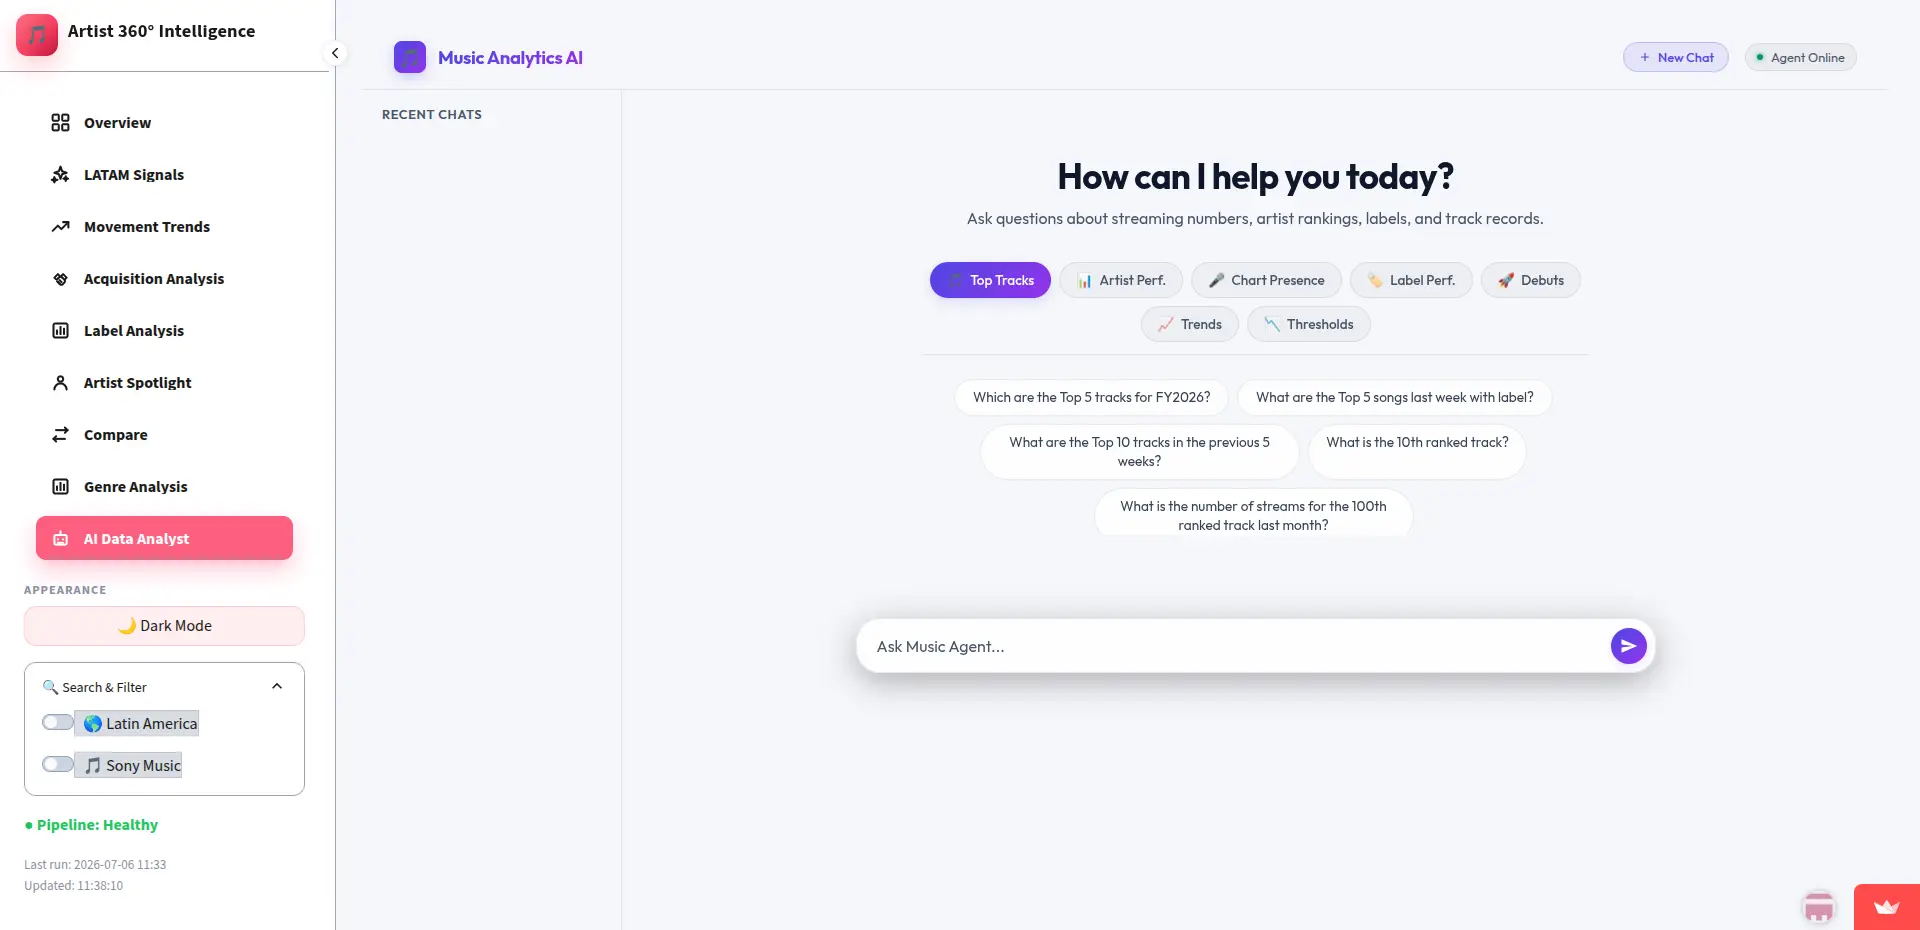
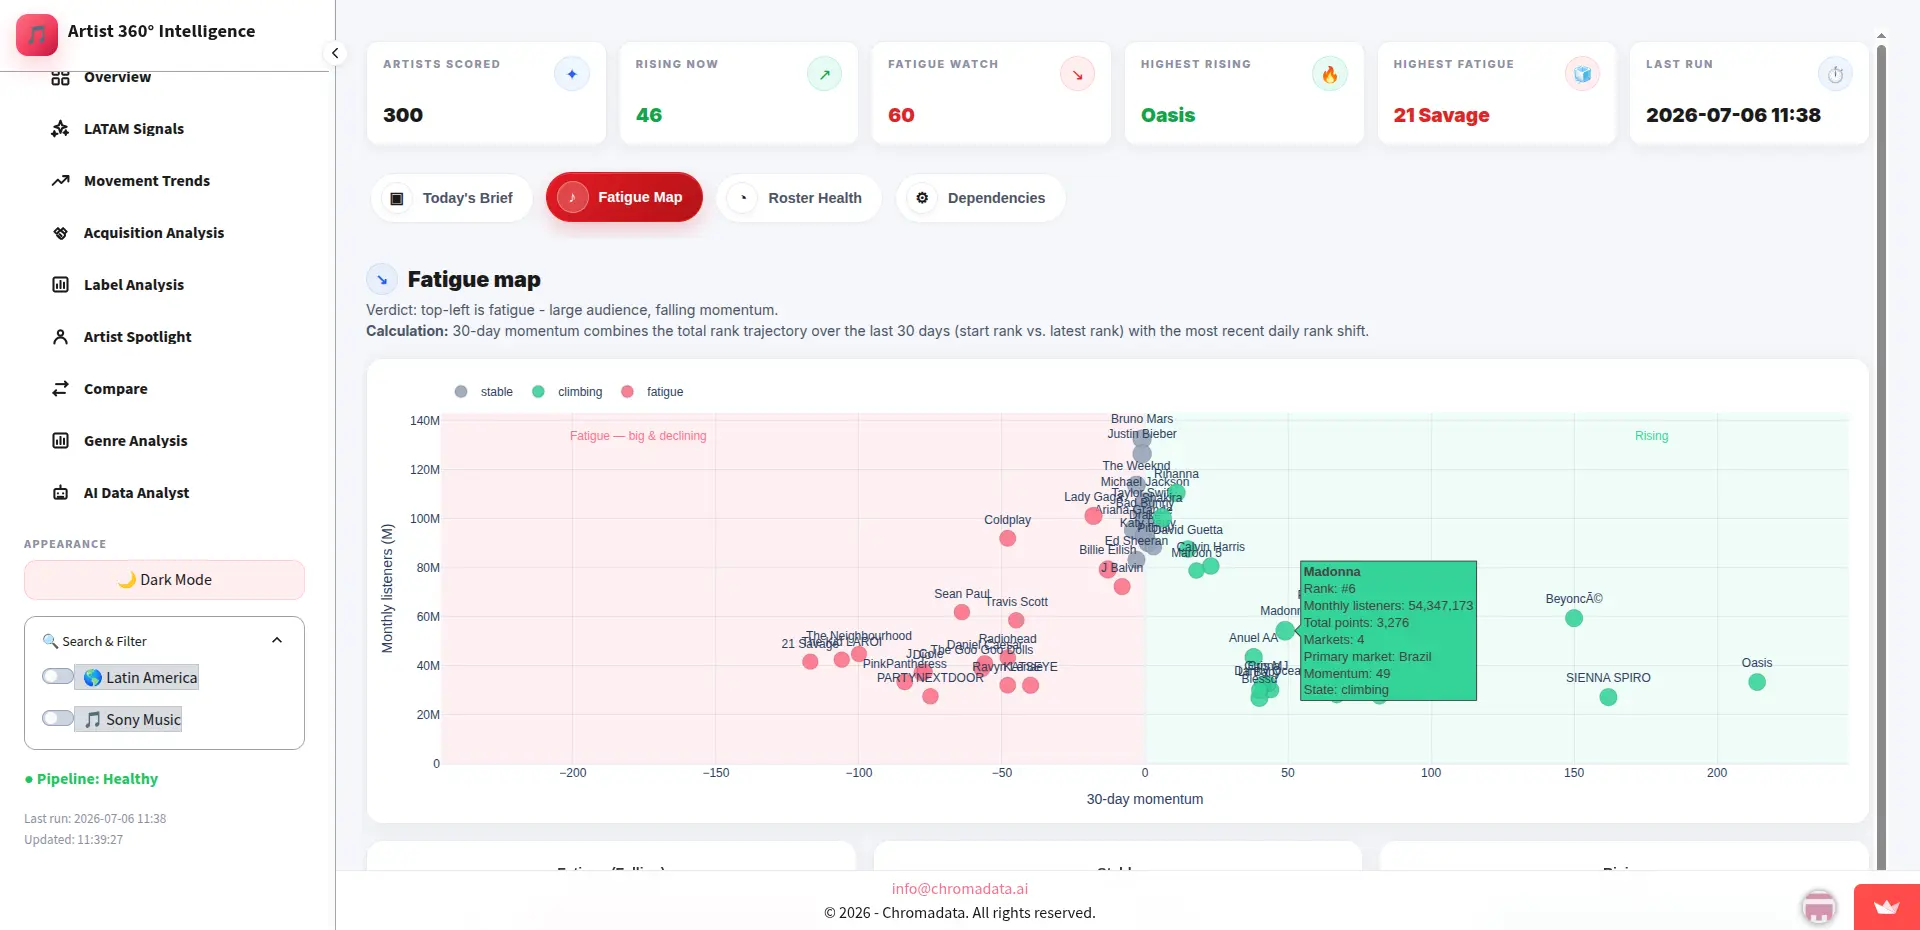
A data-driven artist analytics platform that automates streaming data collection from Kworb and provides interactive dashboards for monitoring artist performance, chart rankings, audience insights, and historical trends.
Three numbers that
tell the story upfront.
Automated artist data collection
A data-driven artist analytics platform that automates streaming data collection from Kworb and provides interactive das…
Data synchronization
A data-driven artist analytics platform that automates streaming data collection from Kworb and provides interactive das…
Reduction in manual reporting effort
A data-driven artist analytics platform that automates streaming data collection from Kworb and provides interactive das…
Before we got here,
here's what wasn't working.
Developed a centralized artist intelligence platform that automatically collects streaming and chart data from Kworb, processes it using Python pipelines, stores it in PostgreSQL, and visualizes insights through an interactive Streamlit dashboard. The platform enables historical trend analysis, artist growth tracking, performance reporting, and automated data synchronization.
We confirmed every challenge with the team before writing a line of production code. The right column lists the pain points we tackled head-on and how we approached each one.
What wasn't working
BEFORECollecting accurate streaming and chart data from third-party sources while maintaining reliable updates.
Implemented automated Python scraping pipelines with data validation, cleaning, and scheduled synchronization using PostgreSQL for centralized storage.
Don't over-engineer.
Solve what matters, ship fast.
The instinct on complex projects is to rebuild everything from scratch. We pushed back. A full rewrite often means months of regressions while engineering rebuilds features that were already working.
We mapped the existing workflow against actual usage. The result was clear: a small set of features accounted for the majority of user time. We rebuilt the core, shipped fast, and extended outward.
On the technical side, we made clear decisions early and held them. The right column shows what we chose, and why.
4 decisions we made early
CHOSEN / REJECTEDAutomated Kworb Data Scraping — how we built it
Custom Automated Kworb Data Scraping — built for this product's exact needs and data model.
Generic SaaS tool that would require heavy workarounds and compromise the user experience.
Interactive Artist Dashboard — how we built it
Custom Interactive Artist Dashboard — built for this product's exact needs and data model.
Generic SaaS tool that would require heavy workarounds and compromise the user experience.
Historical Trend Analysis — how we built it
Custom Historical Trend Analysis — built for this product's exact needs and data model.
Generic SaaS tool that would require heavy workarounds and compromise the user experience.
Automated Data Pipeline — how we built it
Custom Automated Data Pipeline — built for this product's exact needs and data model.
Generic SaaS tool that would require heavy workarounds and compromise the user experience.
5 features that
define the product experience.
Every feature was scoped and shipped with the same priorities: speed, reliability, and staying out of the user's way.
Automated Kworb Data Scraping
Automatically collects artist streaming statistics, chart rankings, and platform performance data from Kworb.
Interactive Artist Dashboard
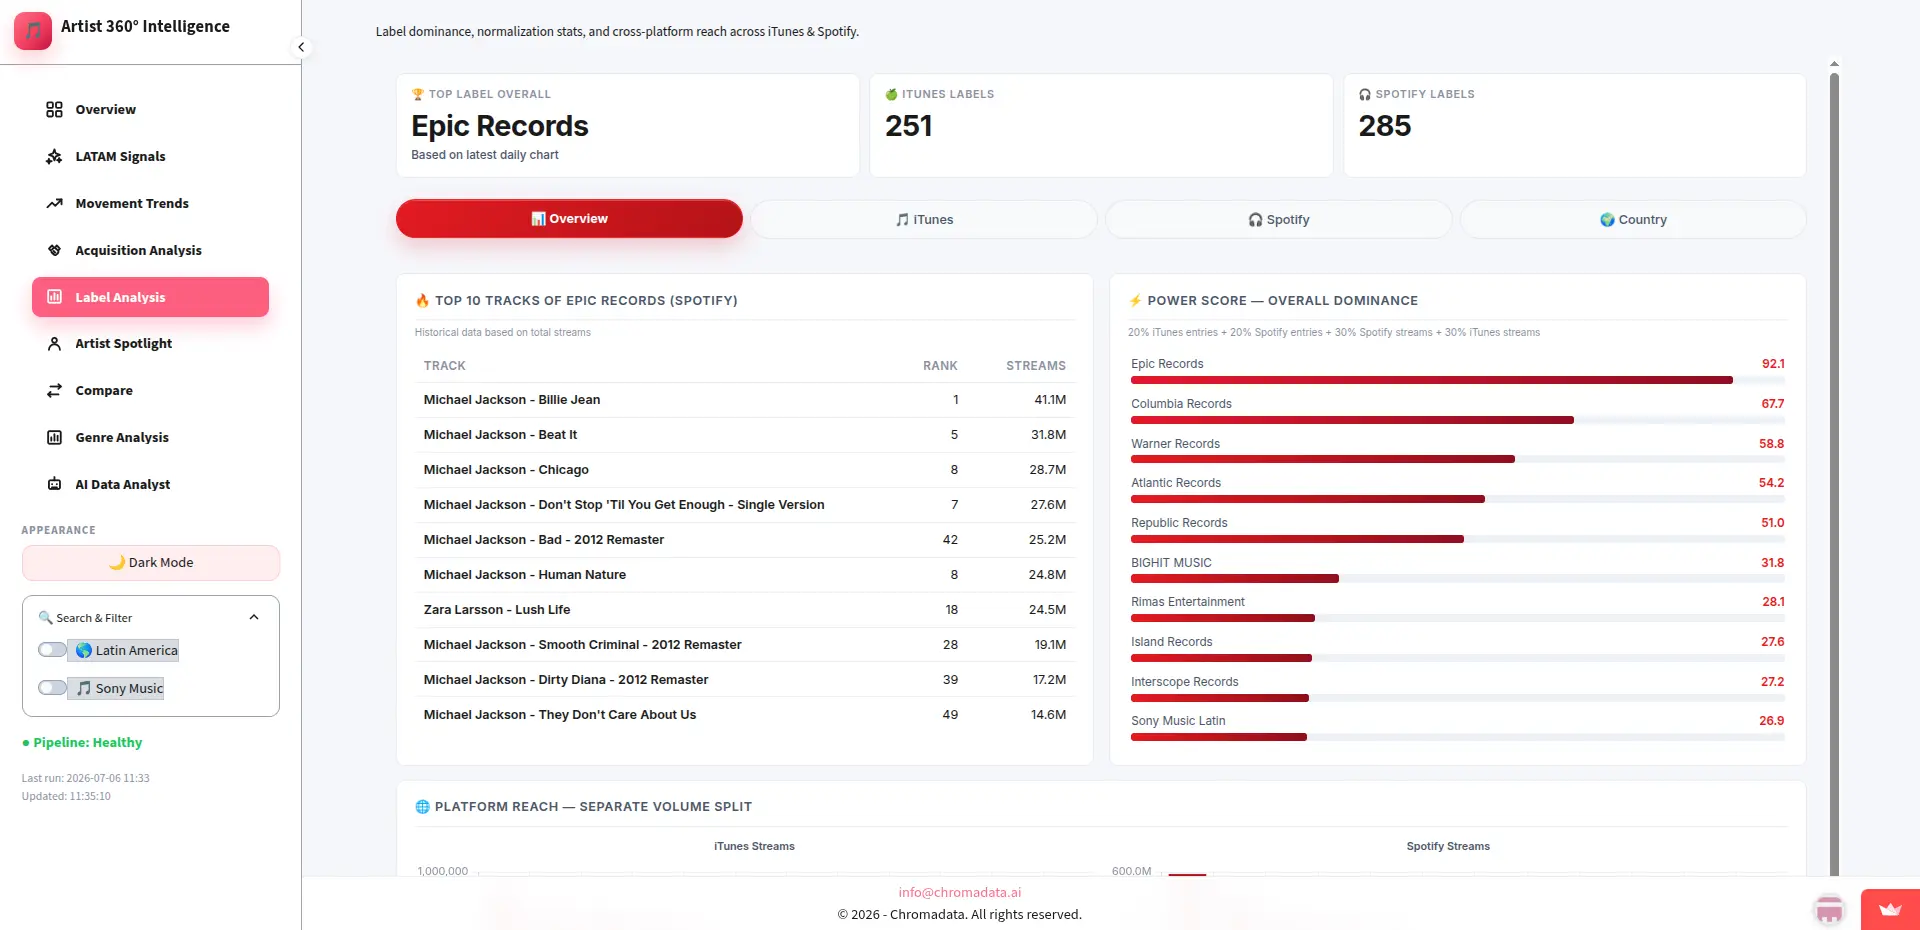
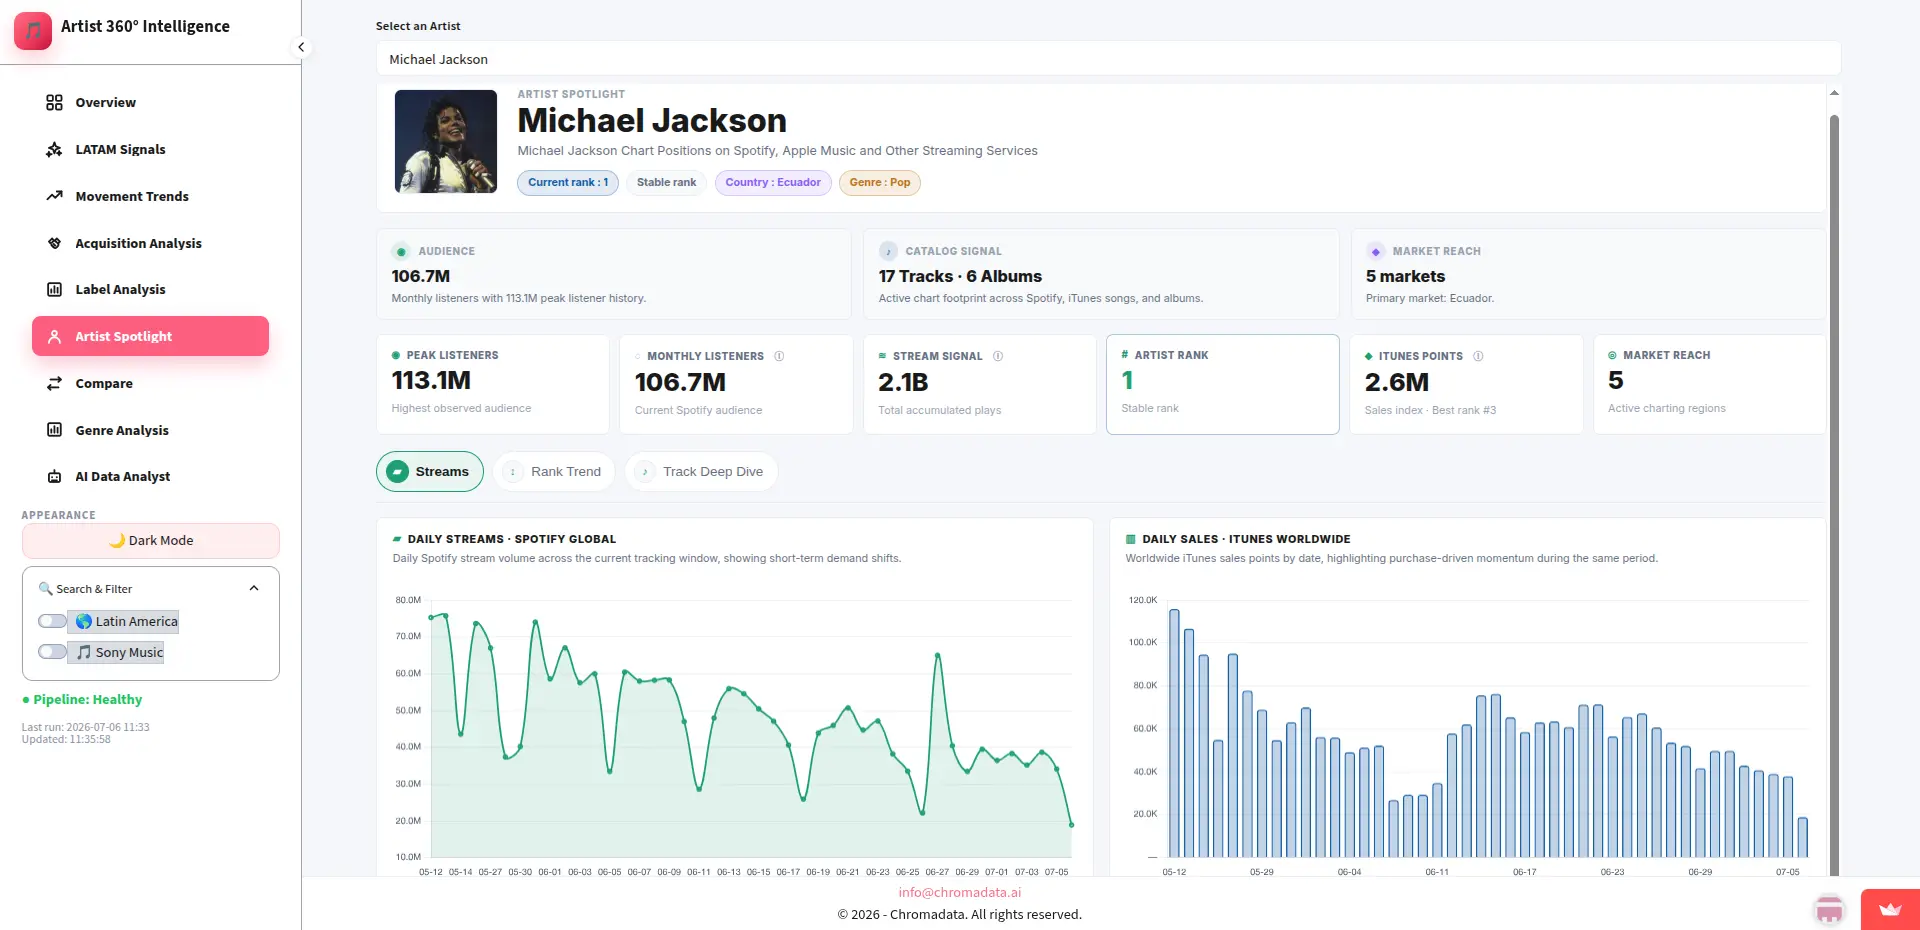
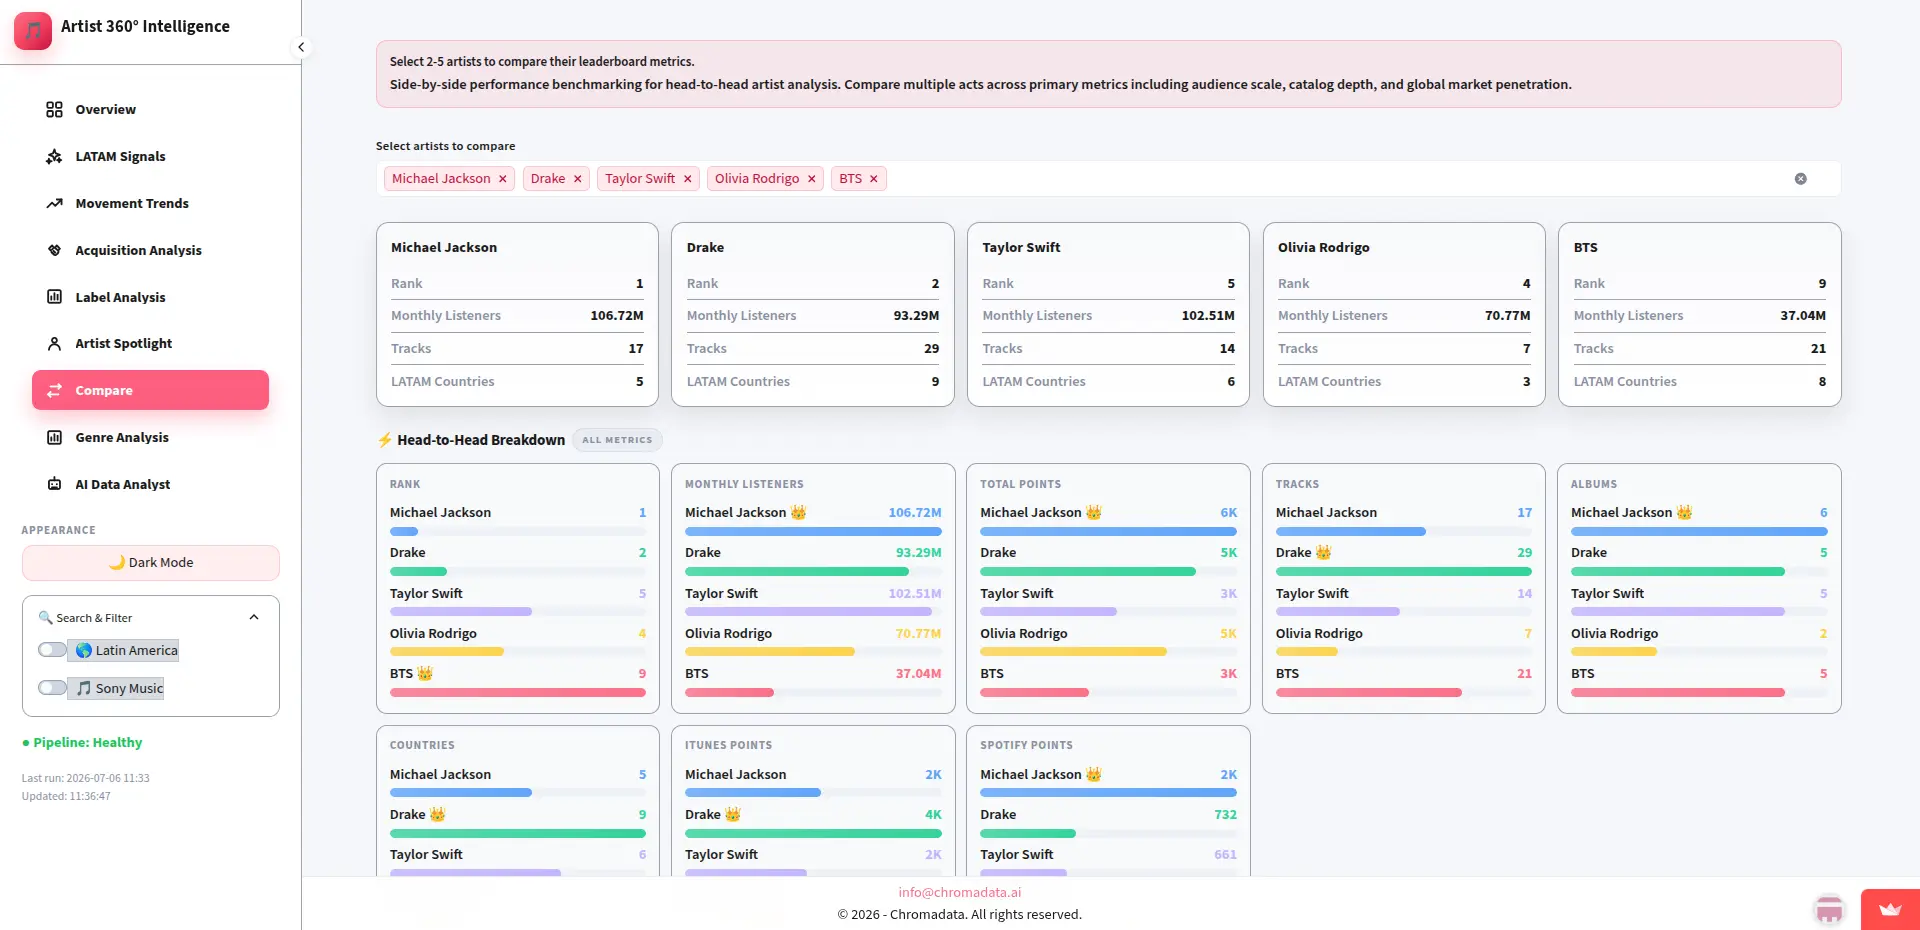
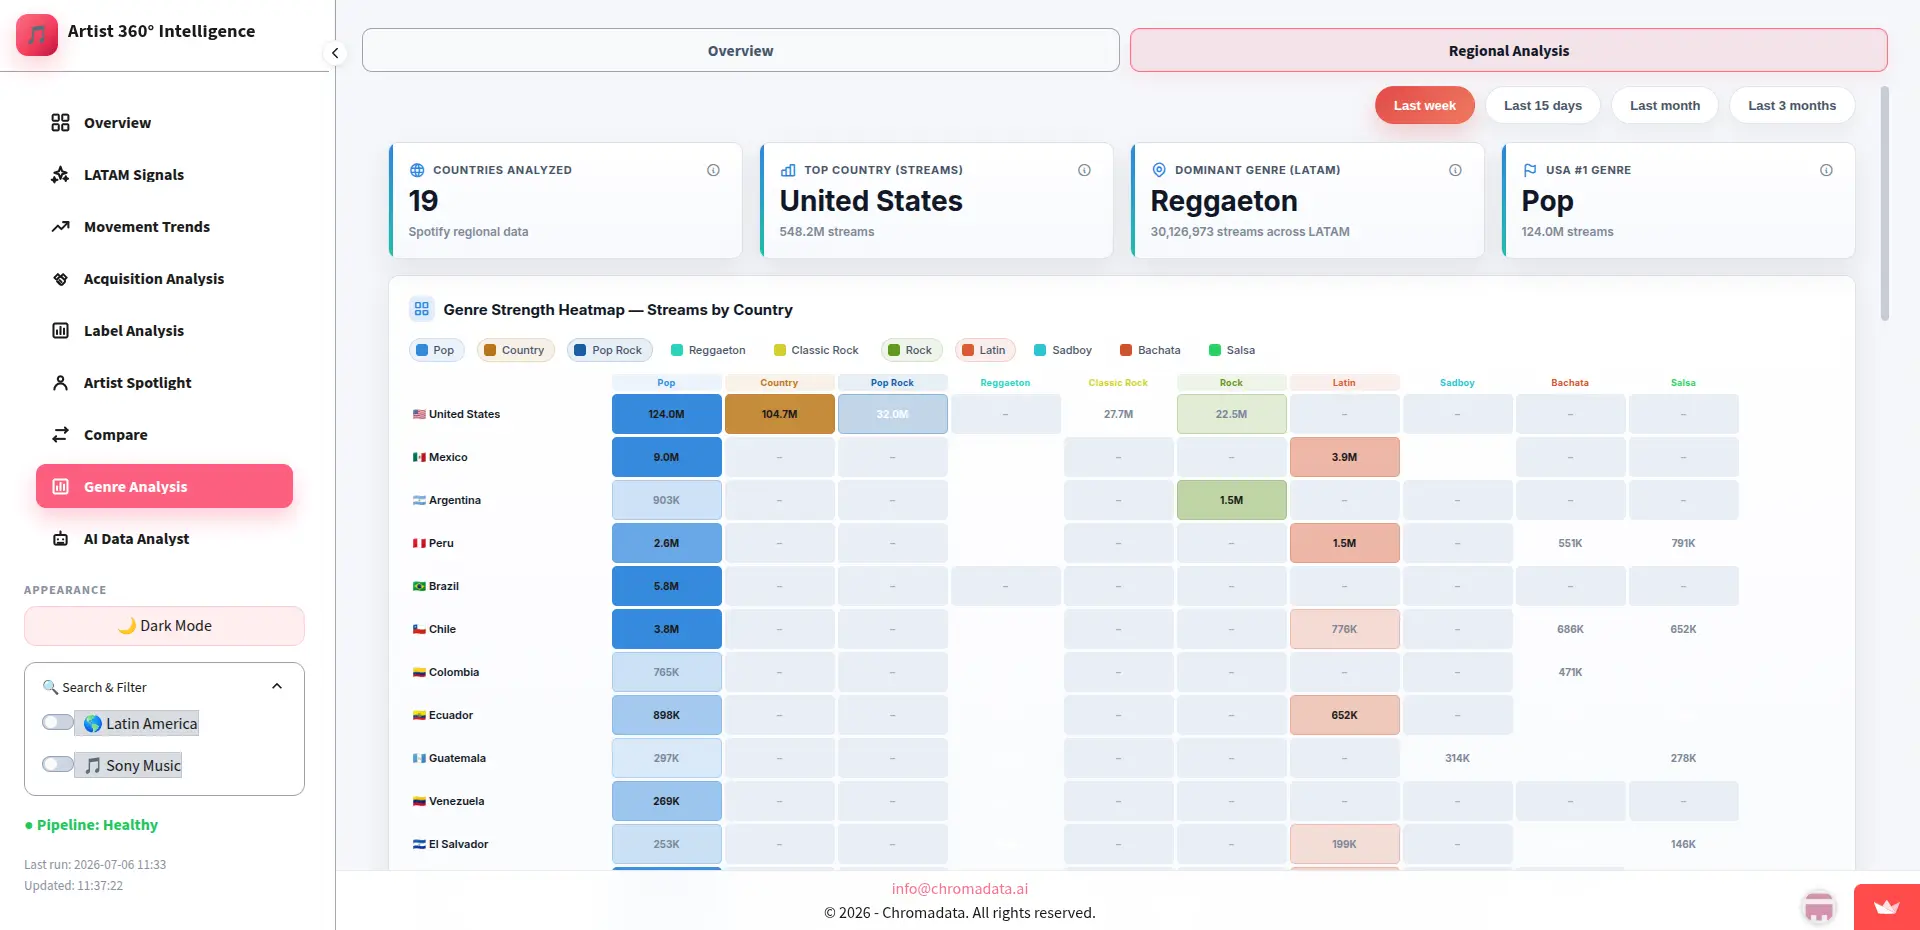
Provides a unified 360° dashboard with artist performance metrics, streaming analytics, and audience insights.
Historical Trend Analysis
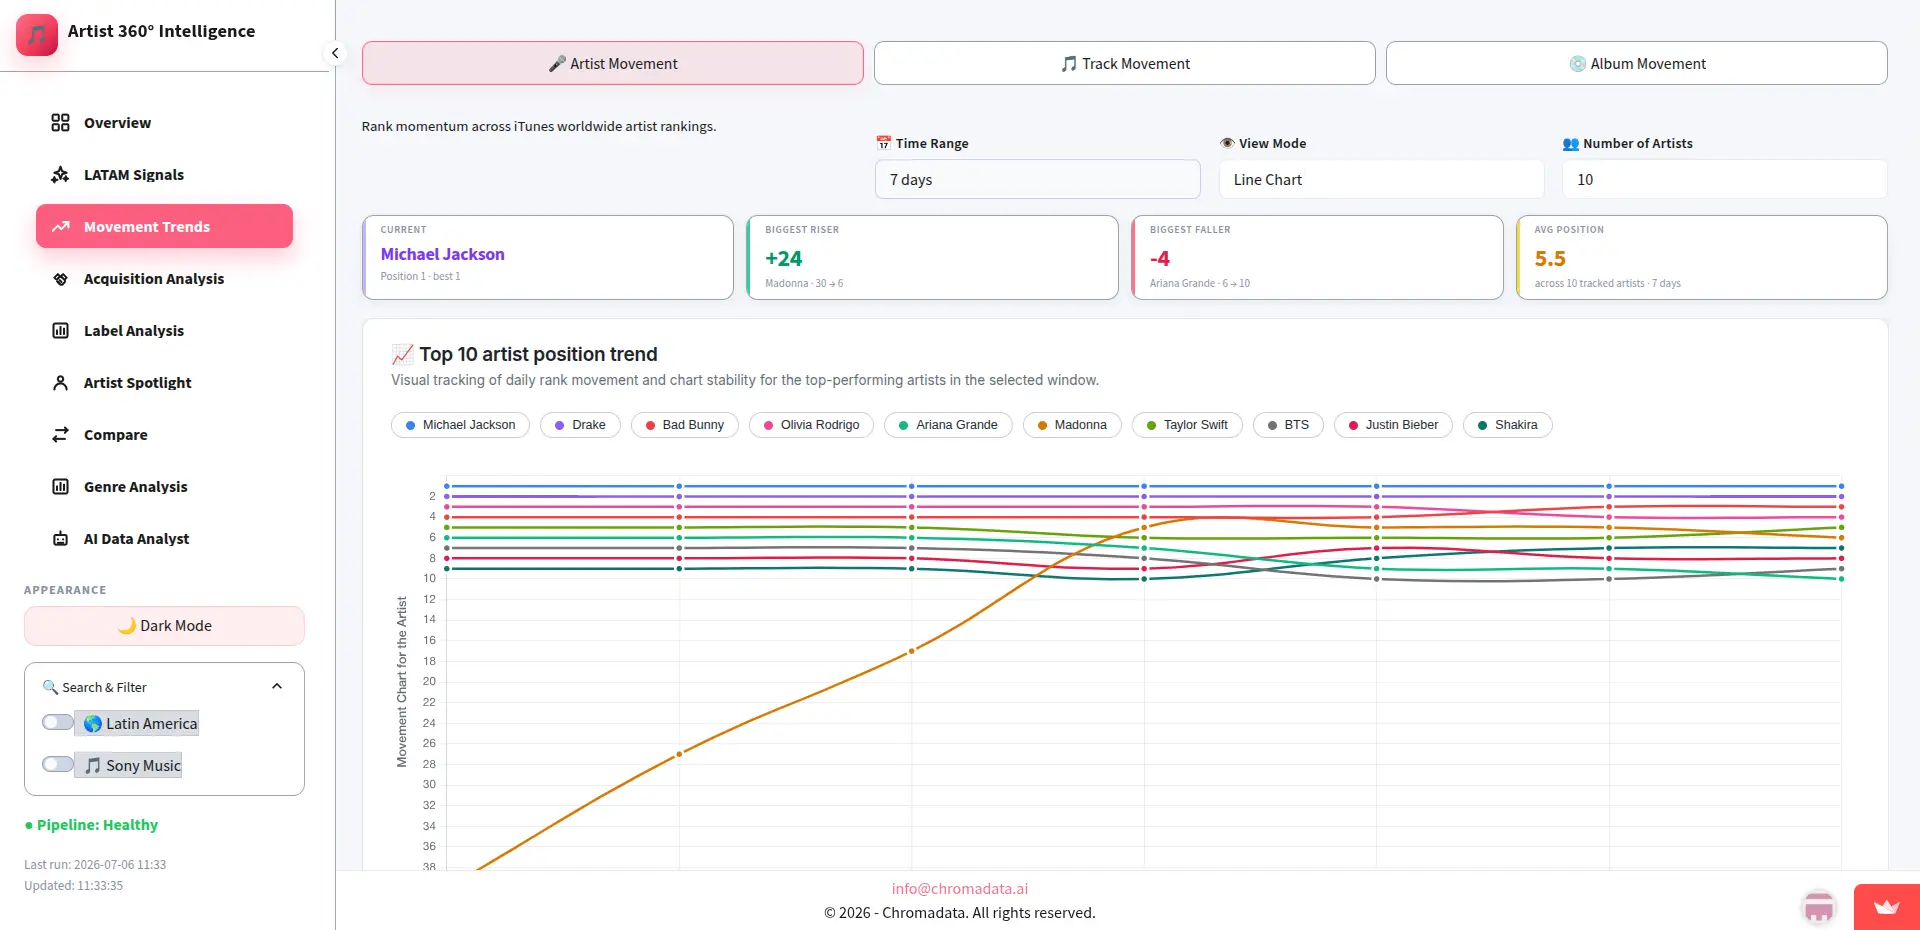
Tracks historical streaming performance, chart rankings, and artist growth over time.
Automated Data Pipeline
Processes, cleans, aggregates, and synchronizes artist data automatically for near real-time reporting.
Performance Visualization
Displays interactive charts and reports for streaming trends, rankings, and artist intelligence.
What changed,
measured against the day-one baseline.
We benchmark before we touch anything, logging every metric below against its state before we wrote a line of production code.
Want to build
something like this?
We ship fast. Talk to us about your product idea and we'll tell you exactly how we'd approach it.