

The Board Doesn't Want the Packet Capture
Somewhere below every executive security conversation sits a mountain of telemetry — millions of log lines a day, thousands of alerts, dozens of half-open investigations. None of it belongs in a board meeting. A CEO doesn't need to see a firewall rule or a MITRE technique ID. They need to answer one question honestly: is the business safe, and are we getting safer or worse?
That translation — from raw technical signal to a decision a non-specialist can make in half a minute — is the entire job of an executive security dashboard. Get it right and security stops being a black box the board funds on faith. Get it wrong and you produce either a wall of numbers nobody reads, or a single reassuring figure that quietly hides the risk underneath.
This piece is about designing the top of the stack — the view a CEO reads in thirty seconds — without lying to them in the process. It sits on top of everything else in the AI-native security platform: every headline number here is the summarised output of a module doing real work below.
The Translation Problem
The gap between what security teams measure and what executives can act on is wider than most people admit. A SOC analyst thinks in indicators of compromise, dwell time, and detection coverage. A CEO thinks in exposure, spend, and whether the last board's risk appetite is being honoured. Neither is wrong; they're speaking different languages about the same thing.
The dashboard is the interpreter. Its job is to take something like "we have 152 assets classified as critical, 18 of them are missing a patch rated high or above, and 3 of those are internet-facing" and render it as a patch-health figure the board can read — while keeping the detail one click away for anyone who wants it.
The failure mode is translating too aggressively. If you compress everything into a single mood-ring number and throw the rest away, you've built a vanity metric. If you refuse to compress at all and hand the board a SIEM export, you've built nothing. The craft is in choosing a small set of headline figures that each mean something specific, each trace cleanly back to a source, and together add up to an honest picture.
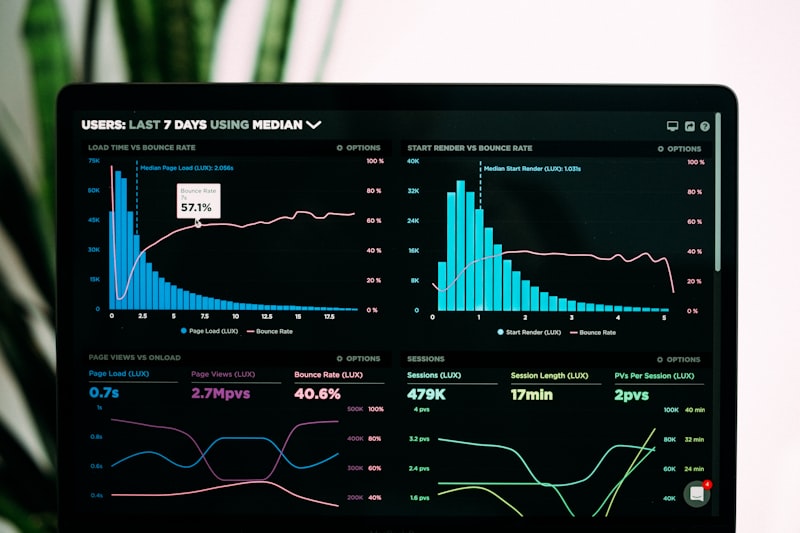
An Executive Security Dashboard a CEO Reads in Thirty Seconds
Here's the shape of a defensible executive view. Nine figures, each answering a question a leader actually asks, each backed by a module that does the work.
| Metric | Typical value | What it answers | Where it comes from |
|---|---|---|---|
| Risk Score | 84 / 100 | Are we broadly safe right now? | Weighted roll-up of the metrics below |
| Critical Assets | 152 | How much really matters? | Asset inventory and classification |
| Threats Today | 12 | Is anything happening right now? | Detection engine |
| Resolved Today | 11 | Are we keeping up? | Incident response / SOAR |
| Pending | 1 | What's still open? | Incident queue |
| Compliance | 91% | Would an audit go well? | Compliance automation |
| Patch Health | 95% | Are known holes being closed? | Vulnerability management |
| Cloud Health | 97% | Is our cloud configured safely? | Cloud security posture (CSPM) |
| Identity Score | 89% | Are accounts and access under control? | Identity security |
A leader should be able to glance at this and reach a conclusion: risk is in good shape at 84, nearly everything detected today was resolved, one item is still open, and the weakest of our posture figures is identity at 89% — so that's where the next conversation should go. That's a thirty-second read that ends in a decision about where attention and money should flow.
Notice what the table does not do. It doesn't show the raw alert count for the day (thousands, most of them noise). It doesn't show query latency or storage utilisation. Those belong to the operators. The board sees outcomes, not machinery.
Designing a Risk Score You Can Defend
The single "Risk Score: 84" is the most useful and most dangerous number on the page. Useful because a board genuinely wants one figure they can track over time. Dangerous because a single number invites everyone to stop thinking — and because it's trivially easy to build one that looks reassuring while real risk hides underneath.
A defensible score has a few properties. First, it's composed, not conjured: 84 is a transparent weighted roll-up of the posture figures below it — compliance, patch health, cloud health, identity, plus live incident pressure — not a figure someone eyeballed. Second, it's decomposable: any executive can ask "why 84 and not 92?" and the answer is immediate — identity at 89% and one open critical incident are the two things dragging it down. Third, its weighting reflects the business, not a vendor default. A company whose crown jewels live in a single cloud account should weight cloud health more heavily than a firm whose main exposure is a large, loosely governed employee base.
The honest danger is the vanity number: a score engineered to sit comfortably in the green because that's what keeps the budget flowing. The tell is that it never moves. Real security posture is noisy — a bad patch cycle, a new acquisition's messy estate, a spike in phishing should all move the needle. A risk score that reads 84 quarter after quarter isn't stable, it's asleep. If you can't explain the last three things that moved it, it isn't measuring anything.
Trend Beats the Snapshot
A point-in-time number answers "are we safe today?" A board's harder question is "are we getting better or worse, and is the money working?" That question can only be answered with a trend.
The same nine metrics become far more valuable plotted over weeks and quarters. A Risk Score of 84 means one thing if it was 71 last quarter and quite another if it was 93. Patch Health at 95% is reassuring on its own — but if it's been sliding two points a month, you're watching a process decay in slow motion, and the snapshot would never have told you. Trend is also how security spend gets justified: when the board approved budget for identity tooling and the Identity Score climbed from 78% to 89% over two quarters, the investment defended itself in one line.
So a mature executive dashboard is really two views stacked together — the thirty-second snapshot for "where are we now," and a set of trend lines for "which way are we heading." The snapshot triggers the glance; the trend triggers the decision.
Tying Each Headline Back to Its Module
The credibility of the whole dashboard rests on every number being traceable. A headline figure that can't be drilled into is a claim, not a metric. Each of the nine ties back to a module doing real work:
Compliance 91% is the compliance centre reporting the share of mapped controls with current, passing evidence against SOC 2 or ISO 27001 — not a self-assessment, but the actual state of collected evidence.
Patch Health 95% is vulnerability management reporting critical and high vulnerabilities remediated within policy — the honest version weighting internet-facing critical assets far more heavily than a dev laptop.
Cloud Health 97% is CSPM reporting the proportion of cloud resources passing posture checks: no public storage buckets, no over-permissive IAM roles, encryption on by default.
Identity Score 89% is identity security reporting MFA coverage, dormant privileged accounts, and anomalous access — the messy human layer that's usually the weakest number on any honest board.
Threats Today, Resolved, Pending come straight off the detection and response pipeline. When a leader clicks "1 pending," they should land on the actual open incident, not a spinner. That path from headline to underlying record is what separates a dashboard from a poster.
What Good Looks Like
A well-built executive dashboard has a recognisable set of qualities:
Every number is drillable. No figure is a dead end. A CEO can click Compliance 91% and reach the failing controls; click Identity 89% and reach the dormant admin accounts.
The risk score is transparent. Anyone can see how it's composed and what's currently dragging it down. It moves when reality moves.
Trend sits beside the snapshot. The board sees direction, not just position — and can tell whether last quarter's investment worked.
It shows outcomes, not machinery. Alert volumes, storage, and latency stay with the operators. The board sees exposure, resolution, and posture.
It's honest about the weak spot. A good dashboard makes the lowest number easy to find rather than burying it. The 89% you'd rather not discuss is exactly the one the board should see.
Questions to Ask Before You Build One
"How is the risk score composed, and what moved it last quarter?" If nobody can explain the weighting or name the last three things that shifted it, it's a vanity number dressed as a metric.
"Can every headline figure be drilled into?" A number that can't reach its underlying records is a claim. Push until each one has a path down to the source.
"Does this show trend or just today?" A snapshot alone can't answer whether the business is improving or whether spend is working. Both views should exist.
"What's the weakest number, and is it easy to find?" If the dashboard makes the uncomfortable figure hard to see, it's built to reassure rather than inform — which is worse than no dashboard at all.
What It Costs and How Long It Takes
The dashboard itself is not the expensive part — the modules feeding it are. If compliance mapping, vulnerability management, CSPM, and identity monitoring already produce trustworthy numbers, assembling a genuinely useful executive view is typically a two-to-four-week piece of work: designing the roll-up logic, wiring the drill-downs, and building the trend store so history accrues from day one.
The catch is that the dashboard is only as honest as its inputs. Build the executive view before the underlying modules are solid and you get a beautiful screen reporting numbers nobody should trust — which is arguably worse than no dashboard, because it manufactures false confidence at the board level. The sensible sequence is to stand up the posture modules first, let their numbers settle, and add the executive layer once each headline figure is something you'd defend under questioning. Retrofitting trend history is also painful, so it's worth capturing time-series data from the first day even if the board view comes later.
Related guides
- Building an AI-native security operations platform: the complete architecture
- Compliance automation: mapping evidence to SOC 2 and ISO 27001
- Vulnerability management: prioritising the patches that matter
- The AI security copilot: natural-language queries over your data
- AI agent security: what business owners need to know
- Our AI development services
We Build Board-Ready Views on Top of Real Data
We like building the executive layer because it forces honesty about everything beneath it — you can't produce a defensible risk score without modules that actually measure something. We'd start by checking which of your posture numbers you'd genuinely stand behind, build the roll-up and drill-downs on those, and wire in trend from day one so the board sees direction, not just a moment.
If you're weighing how to report security risk to a board — or you've got a dashboard that looks reassuring and you're not sure you believe it — we're happy to walk through what a defensible version looks like for your business.
Talk to us about your platform — no commitment, just a conversation.
Frequently Asked Questions
What should an executive security dashboard actually show?
A small set of business-legible figures, each answering a question a leader asks and each traceable to a source. A typical shape is a single risk score, a count of critical assets, live threat and resolution figures, and four posture percentages — compliance, patch health, cloud health, and identity. What it should not show is operational machinery: raw alert volumes, query latency, storage utilisation. Those belong to the security team, not the board. The test is whether a non-specialist can read the whole thing in about thirty seconds and reach a decision about where attention should go.
Is a single "risk score" a good idea or a dangerous oversimplification?
Both, depending on how it's built. A single score is genuinely useful because boards want one figure to track over time. It becomes dangerous when it's a vanity number — engineered to sit in the green regardless of reality. A defensible score is composed from the posture metrics below it with weightings that reflect the business, it's decomposable so anyone can ask why it's 84 and not 92, and it moves when reality moves. The clearest warning sign is a score that never changes: real posture is noisy, so a figure that reads the same quarter after quarter isn't stable, it's ignoring something.
How do I avoid a dashboard that looks reassuring while real risk hides underneath?
Insist on three things. First, every headline number must drill down to its underlying records — a figure that can't be traced is a claim, not a metric. Second, the weakest number must be easy to find; a dashboard that buries the uncomfortable figure is built to reassure rather than inform. Third, watch whether the numbers move. Manufactured confidence usually shows up as suspiciously stable, always-green metrics. If you can't get a straight answer to "what's our worst number and why," the dashboard is decorative.
Why does trend matter more than a point-in-time snapshot?
A snapshot answers "are we safe today?" A board's harder and more useful question is "are we improving, and is the money working?" Only a trend can answer that. A risk score of 84 means something very different if last quarter it was 71 versus 93. A patch-health figure that looks healthy today but has been sliding for three months is a decaying process the snapshot would never reveal. Trend is also how security spend justifies itself — an identity score climbing from 78% to 89% after the board funded identity tooling defends the investment in a single line.
How does each dashboard number connect to what the security team actually does?
Every headline is the summarised output of a module doing real work. Compliance percentage comes from the compliance centre reporting controls with current passing evidence. Patch health comes from vulnerability management. Cloud health comes from cloud security posture management checking for public buckets and weak IAM. Identity score comes from identity monitoring — MFA coverage, dormant admins, anomalous access. Threat and resolution counts come off the detection and response pipeline. The credibility of the executive view rests entirely on those connections being real and drillable, not decorative labels over invented figures.
How long does it take to build an executive security dashboard?
The dashboard layer itself is typically a two-to-four-week piece of work — designing the roll-up logic, wiring drill-downs, and building the trend store. But it's only as trustworthy as its inputs, so the honest timeline depends on whether the underlying modules already produce numbers you'd defend. If they do, the executive view is quick. If they don't, building the dashboard first just manufactures false confidence at board level. The sensible order is to stand up the posture modules, let their numbers settle, then add the executive layer — while capturing time-series data from day one so trend history exists when you need it.